The recovery from the freight recession continues to be driven by reduction in capacity rather than by increased demand.
Freight and rate indicators from May and June paint a picture of a freight rate recovery without a major increase in actual freight.
The recovery from the freight recession continues to be driven by reduction in capacity rather than by increased demand. Reports from the American Trucking Associations, DAT Freight & Analytics, the National Retail Federation and others bear this out.
ATA Tonnage Index
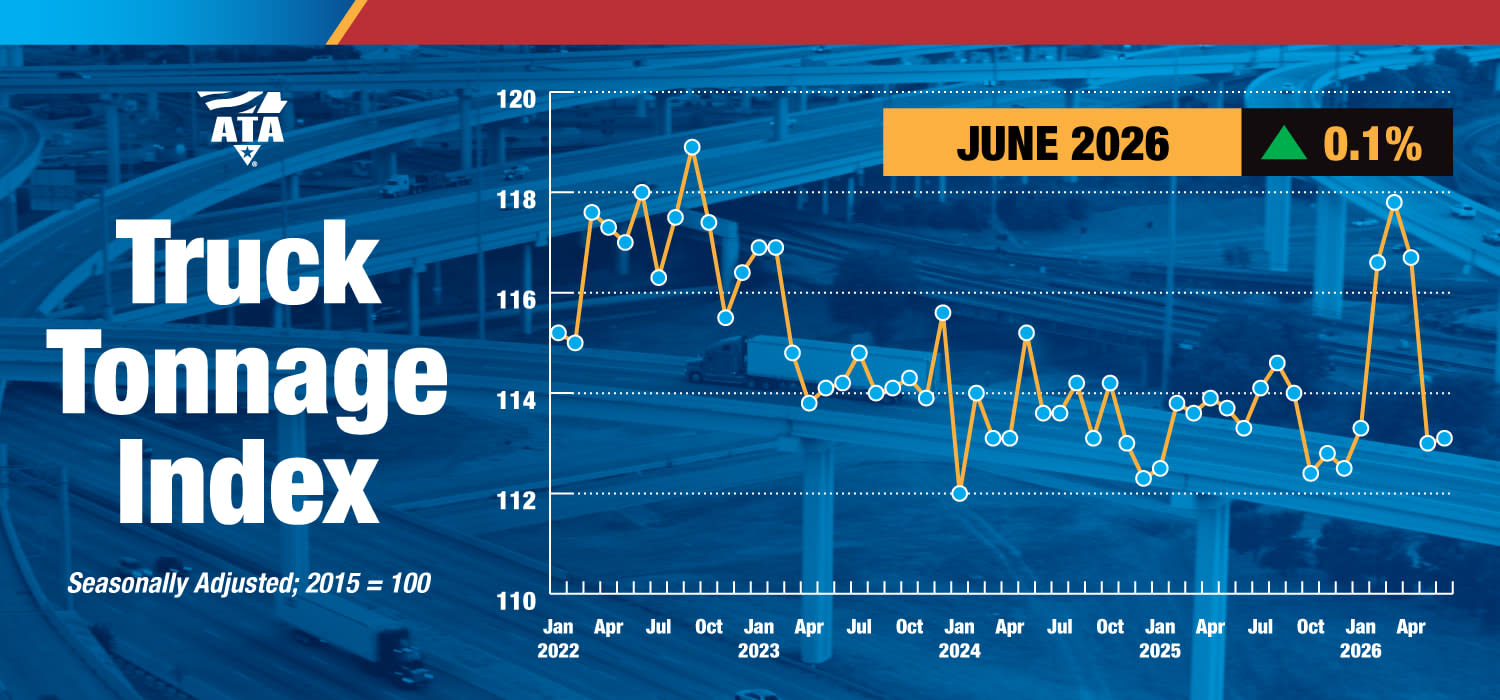
Trucking activity in the United States rose 0.1% in June after falling more than 3% in May, according to the American Trucking Associations’ For-Hire Truck Tonnage Index.
ATA Chief Economist Bob Costelloexplained that while tonnage was little changed in June, there was a definite weakening in volumes during the second quarter, as the index contracted by more than 4% in April and May.
“After five straight year-over-year gains, tonnage has now contracted from year-earlier levels for the last two months,” Costello said.
“While the U.S. economy remains on solid footing overall, the freight economy isn’t as strong. With that said, the decrease in capacity over the last year probably has fleets feeling a little better than volumes would suggest.”
In June, the ATA advanced seasonally adjusted For-Hire Truck Tonnage Index equaled 113.1. The index, which is based on 2015 as 100, decreased 0.1% from the same month in 2025, which was better than May’s 0.7% drop.
During the first half of the year, tonnage was up 1.4% from the same period last year thanks to strength in the first quarter.
The not seasonally adjusted index, which calculates raw changes in tonnage hauled, equaled 116.5 in June, 2.7% above May’s reading of 113.4.
ATA noted that its tonnage indexes are dominated by contract freight, as opposed to spot market freight. The tonnage index is calculated on surveys from its membership and has been since the 1970s.
Imports
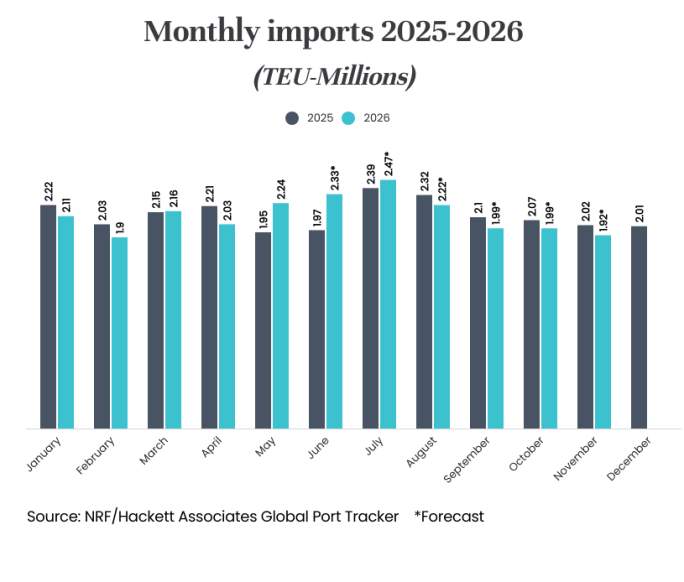
Import containers may be going gangbusters, but overall the amount of freight being moved by truck has recently been largely stagnant.
National Retail Federation
Import volume at the nation’s major container ports is forecast to hit a new all-time record in July, driven by retailers stocking up ahead of expected tariff increases, according to the Global Port Tracker report by the National Retail Federation and Hackett Associates.
“This year’s early peak season is expected to continue through July as retailers and other importers prepare for potentially higher tariffs beginning in August and other trade uncertainties,” NRF Vice President for Supply Chain and Customs Policy Jonathan Gold said, noting continued supply chain impacts from the conflict in Iran.
The Port of Los Angeles saw the busiest June in its 118-year history and the third time monthly cargo volume has ever exceeded 1 million container units. Dockworkers at the Port of Los Angeles moved 1,002,734 Twenty-Foot Equivalent Units (TEUs) in June.
Breakthrough
However, reports Breakthrough, freight demand held essentially flat year-over-year in May. Breakthrough’s freight volumes rose just 0.2%, as gains in paper and packaging and retail offset softness in durable goods, consumer packaged goods, and food and beverage.
Truckload capacity is the dominant rate driver, shaped by regulatory enforcement, the broker liability ruling, and rising costs, according to Breakthrough.
DAT Freight & Analytics
DAT’s Truckload Index
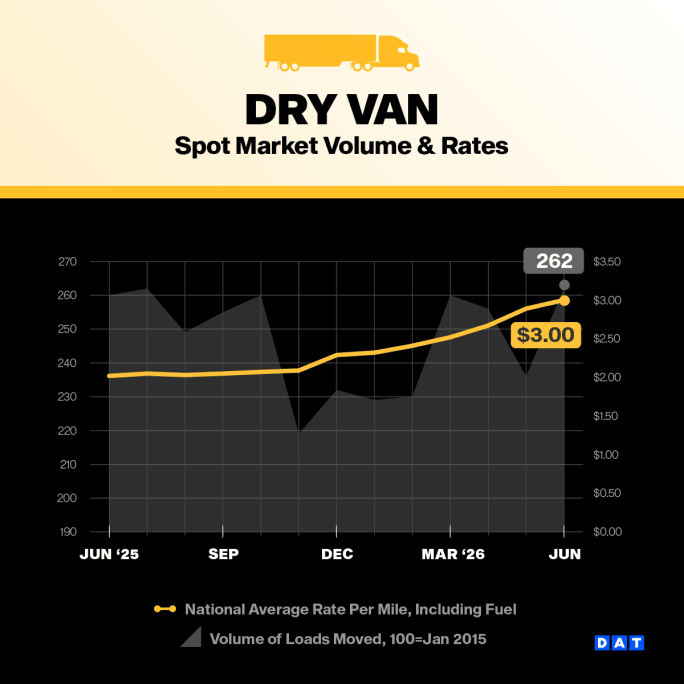
DAT Freight & Analytics reported that June truckload rates climbed faster than freight volumes, a disparity that points to tighter truck capacity rather than stronger freight demand.
The DAT Truckload Volume Index, which measures loads moved during the month, rose across all three equipment types compared to May:
- Dry van TVI: 262, up 11% from May but roughly flat compared to June 2025
- Refrigerated TVI: 184, up 5% from May but down 8% from June 2025
- Flatbed TVI: 308, up 12% from May but down 4% from June 2025
The national average van truckload spot rate exceeded the contract rate in June for the first time since February 2022, and overall rate growth far exceeded volume growth last month.
Spot linehaul rates increased at least 39% year over year across all three equipment types, while volumes were flat to lower.
Capacity has continued to tighten amid regulatory changes and immigration enforcement, reducing the supply of qualified truck drivers, according to DAT.
Spot Rates Climb Faster Than Volume
Dry van, refrigerated, and flatbed spot rates all increased in June, according to DAT, with flatbed spot rates hitting a new all-time high. The gains came as freight volumes rose more modestly, reinforcing signs of capacity tightening.
Year over year, the national average van linehaul rate was up 74 cents in June, reefer was up 76 cents, and flatbed was up 84 cents.
Rates increased 45% for van freight, 39% for refrigerated, and 40% for flatbed, the largest year-over-year percentage increases in linehaul rates since June 2021 for vans and since July 2021 for reefers and flatbeds.
National average contract rates were mixed in June, according to DAT’s data. All-in pricing slipped for van and refrigerated freight as lower fuel surcharges offset gains in linehaul rates, while flatbed edged higher.
Spot Rates vs. Contract Rates
The national average van spot rate moved above contract for the first time since February 2022, according to DAT.
“The difference between spot and contract rates has narrowed steadily for more than a year, and carriers are gaining pricing power across the board,” said Dean Croke, DAT industry analyst.
“Van spot beating contract for the first time in four years, and flatbed hitting an all-time high in the same month, shows real capacity pressure.
“If demand were driving this, volumes would be climbing too, and they’re not.”
Credit: Source link