

Fleets needn’t look long or hard to find products promising fuel-saving benefits. Aerodynamic add-ons, low-viscosity lubricants, tires, software platforms, “magic” elixirs, and even bottles of distilled water all promise incremental gains that can add thousands of dollars to the bottom line.
The problem fleets face when making buying decisions is not a lack of options — it’s a lack of confidence.

Determining which technologies genuinely reduce fuel consumption, by how much, and at what cost has historically been fraught with inconsistency. For decades, fleet managers have been asked to commit millions of dollars based on results they couldn’t always trust.
Much of that inconsistency can be traced back to the way fuel economy testing has traditionally been conducted and reported. In some cases, the testing process lacked transparency.
In others, the improvements being measured were so small that they fell within the margin of error of the test itself. As with many technologies that promise marginal gains, separating real improvements from statistical noise proved difficult.
Fifteen years ago, when interest in trailer aerodynamic devices began to accelerate, suppliers relied on a wide range of test methods to demonstrate effectiveness. Products were evaluated on closed tracks, in wind tunnels, through coast-down testing, and using computational fluid dynamics. Fleets also conducted their own in-service tests, often stretching over months, with results that were only as reliable as the controls applied.
Not surprisingly, vendors gravitated toward test methods that showed their products in the best possible light. Wind tunnel results required mathematical modeling to estimate real-world fuel savings. Track tests were typically conducted at steady speeds under ideal conditions. Fleet-run in-service tests were influenced by driver behavior, weather, terrain, traffic, and equipment differences.
The outcome was predictable. Fleets frequently reported real-world savings that were far lower than promised. Closed-track testing bore little resemblance to real-world duty cycles involving congestion, grades, variable speeds, and weather. Over time, fleets grew accustomed to discounting vendors’ claims — often cutting projected savings in half when calculating return on investment.
Compounding the problem was the industry’s reliance on expressing fuel savings as a percentage.

Percentages fail fleets
Percent improvement is based on how much fuel is consumed, not how much fuel is saved. An aerodynamic device, such as a trailer skirt, will reduce aerodynamic drag by a relatively fixed amount regardless of vehicle weight or rolling resistance. Yet when that reduction is expressed as a percentage, the result changes depending on the truck’s baseline fuel economy, explains Daryl Bear, chief operating officer and lead engineer at Mesilla Valley Transportation Solutions (MVTS).
“The truck with poor fuel efficiency would use more fuel, so the fuel saved, expressed as a percentage of fuel consumed, might be 4% for example,” he told trucknews.com. “An empty trailer, on the other hand, burns less total fuel so the percentage saved amounts to a greater value, such as 5 or 6% for the same technology. Percent savings sounds intuitive, but it is misleading.”
Bear, born and raised in southern Ontario, is the lead engineer at MVTS, based in Las Cruces, New Mexico. A professional mechanical engineer, he honed his testing skills and ideas in motorsports, working first with race car testing experts, Multimatic, and later with top-tier racing teams in NASCAR and IndyCar.
Bear eventually brought that discipline into trucking through a partnership with Royal Jones, owner of Mesilla Valley Transportation, a fleet widely regarded as one of the most fuel-efficiency-focused carriers in North America. Jones was initially skeptical of Bear’s testing methods, having seen countless fuel-saving claims over the years. That skepticism quickly faded when the data proved repeatable, transparent, and actionable.
After testing more than 100 technologies in the first year and uncovering substantial fuel savings, the collaboration evolved into Mesilla Valley Transportation Solutions. Today, MVTS provides high-precision fuel-economy testing to fleets, suppliers, and OEMs across the trucking industry.
One of the company’s defining characteristics is how it expresses results.
“Fleets can understand gallons-per-1,000 miles regardless of conditions such as weight, tires, or driver behavior. It is a much more consistent way to measure fuel savings. Fleets find it beneficial for purchase planning.”

Track testing vs. road testing
MVTS conducts both track testing and on-road testing, with each approach serving a distinct purpose.
“Track testing is ideal for steady-state evaluations like aerodynamics or tire performance,” Bear explained. “The controlled environment produces cleaner, more repeatable data.”
Track testing is conducted at the Texas Test Track near Pecos, Texas. It opened in 1961 as BF Goodrich’s tire testing facility and is now privately owned. It offers a nine-mile (14-km) perfectly circular track with minimal elevation change and remarkably consistent weather patterns.
Typical test run consists of 12 laps around the track using two nearly identical trucks running at a fixed speed about one minute apart. One truck serves as the control vehicle; the other carries the equipment being evaluated.
Each lap is broken out as an individual data set. If a lap deviates from the norm, it is flagged or removed. Because distance and speed are precisely controlled, variables such as tire diameter and odometer error are eliminated. Over thousands of laps, MVTS has built a robust statistical baseline that allows small differences to be detected with confidence.
Road testing, by contrast, captures real-world duty cycles, including acceleration and deceleration, hills, traffic, etc.
This makes it especially useful for evaluating powertrain components, gear ratios, and drivetrain configurations — and comparing tractor brands or models to one another.
“When using a road test for evaluating gear ratios, for example, we can see how the how various gear ratios affect acceleration, uphill and downhill performance and overall fuel economy,” Bear pointed out. “If you did that at the track, because it’s such a low torque, steady speed, the results would suggest going to a higher ratio — a lower engine speed — without considering the impact on drivability and performance.”
Rather than favoring one method over the other, MVTS uses both, for different purposes, and often cross-validates results to ensure conclusions hold up under different operating conditions.
Data acquisition
Trucknews.com visited the MVTS test track to observe an in-progress test involving several “low-yield” but low-cost aerodynamic devices whose individual gains would be difficult to measure using conventional methods. The range of improvements is fairly small, but not inconsequential over a fleet of trucks.
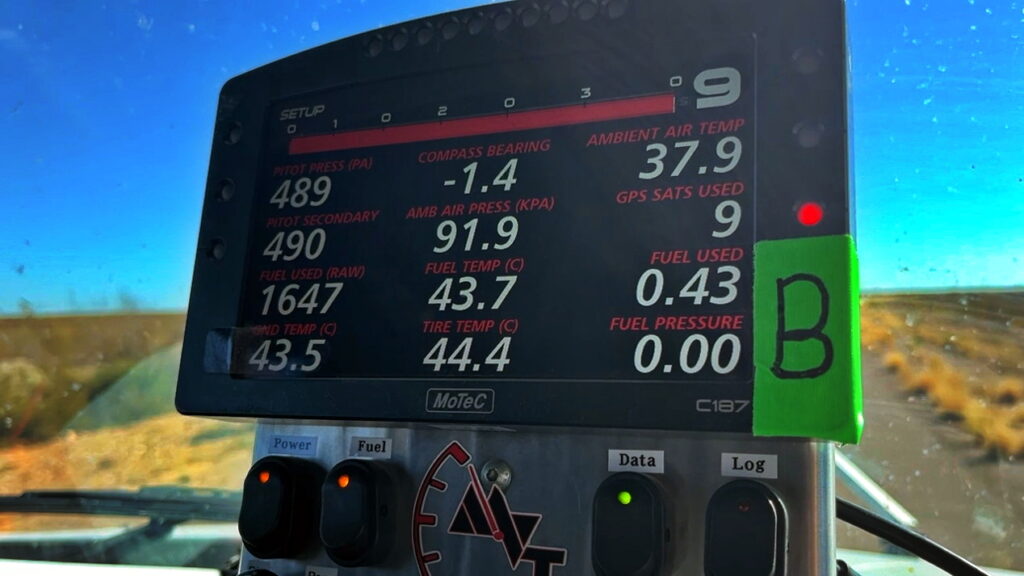
The test trucks are instrumented much like race cars, using a sophisticated data acquisition system that records dozens of parameters simultaneously. Hood-mounted sensors measure air speed, air pressure, and wind direction, enabling engineers to track the environmental influence on fuel consumption.
Engine parameters such as turbocharger speed, intake air mass flow, percent of engine torque and engine speed, etc., help identify subtle changes in load.
Tire and ground temperatures are also monitored to calculate rolling resistance.
“Combining that with aerodynamic drag and other fuel-consuming losses, we can calculate how much fuel the truck should be consuming and compare those values to how much fuel it is actually consuming,” Bear told us. “That is our patented Energy Method process; it improves accuracy considerably. At the same time, we run the second truck as the compare vehicle and obtain greater reliability in the test results.”
Turning data into decisions
Fuel consumption is measured using a high-precision fuel-flow meter accurate to 0.2%. In one test, MVTS detected a savings of just 37 milliliters — about one ounce — over a nine-mile (14-km) lap.
“When a truck uses about a gallon per lap, being able to resolve differences of 30 milliliters tells us we’re doing things right,” Bear said. “You simply couldn’t achieve that level of granularity with traditional testing methods. It’s a game changer for making purchasing decisions.”
MVTS recently published results of an on-road test of two axle lubricants. It compared a reformulated lubricant to an existing product (same brand) readily available through most OEMs.
Testing was conducted on a 41-mile (66-km) interstate loop in New Mexico at 65 mph (104 km/h). The tractors were both modern Class 8 sleepers with less than 2,000 miles (3,200 km) on their odometers.
Test results showed the reformulated lubricant improved fuel efficiency by 1.95 gal/1,000 miles on one tractor model, and by 2.35 gal/1,000 miles on another model. That works out to savings of about 200 gallons (750 liters) of fuel per year per truck.
Read the full report here on the MVTS website.
Bear described another interesting investigation in which MVTS helped a fleet identify a single underperforming truck among several otherwise identical units. An extensive investigation involving the fleet and the OEM eventually revealed the odd truck out wasn’t coasting (transmission in neutral) as often as the others, resulting in a fuel loss of about 5%.
Engineers eventually concluded the problem lay in some engine setting parameter buried several layers down in the ECM.
Because this fleet was extraordinarily conscience of fuel efficiency, it sought a solution to the problem. Many fleets would have simply put the difference down to the driver.
Calculating the ROI
As for return on investment, Bear said larger fleets benefit most by spreading testing costs across hundreds or thousands of trucks.
“Cost-wise, it might be hit-and-miss for a fleet of 50 trucks,” he said, “but the average savings a fleet sees when working with us is $1,600 in profit per power unit annually. At five years average tractor life for the first owner, that is like taking $8,000 off the purchase price.”
Time savings can be equally significant. One fleet, considering a major powertrain change, opted for MVTS testing rather than run a year-long in-house evaluation.
“Instead of buying a bunch of trucks and running them for the year before making a decision, they tested with us and had an answer in three days,” Bear said.
MVTS publishes results of testing suppliers have paid for and agreed to publish. The archive includes dozens of products for tractors and trailers, including large devices like trailer skirts and so-called low-yield (and low-cost) devices like perforated mud flaps and wheel covers. And yes, both of those produce quantifiable (and inexpensive) savings. Check the certified technologies section of the MVTS website here.
Credit: Source link


